

Citrix doesn’t provide, out of the box, even with Director, an in-depth latency visualisation for a specific user, or even a group of users. But this is achievable, and in a pretty nice way, using Grafana and the native SQL connector, pointing to the Citrix Monitoring DB.
This tutorial will give you the step by step process to add a user latency monitoring (ICA RTT) in Grafana, for free:
1) Configure a GrafanaReader DB account
It all start by configuring a READ ONLY user account in MSSQL. Read only is mandatory and very important. Oh, I can read your mind right now… do I hear a “yeah.. I don’t need that, I can do it with my admin account, I’m invincible (or super lazy)”? Well, if you do not intend to create a dedicated READ ONLY account, then please leave this tutorial immediately – no jokes! Now that this point has been made crystal clear, let’s proceed.
I prefer to use a local SQL account for Grafana. But depending on the security policies in place in your organisation, you might prefer using an AD account.
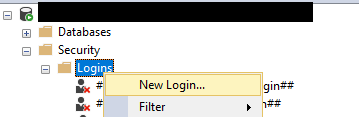
Load up SSMS (SQL Server Management Studio) and login with admin rights to the MSSQL server hosting your Citrix databases (including the Monitoring DB). Under Security / Logins, Create a New Login.
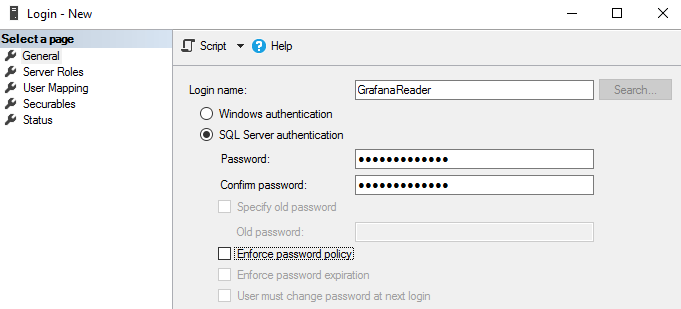
In my case, I create a native SQL account “GrafanaReader” and disable password change (Enforce password policy). Again, you might want to make it more secure, use an AD account, or enforce a password policy.
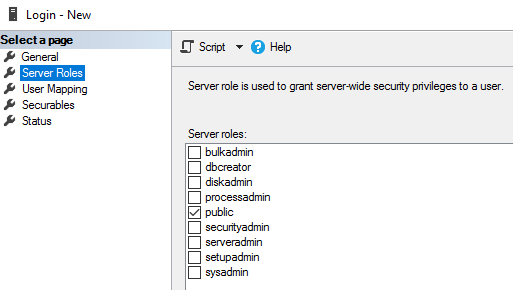
Server Role: leave it as “public” only. This is just a reader account.
Now the essential part, in User Mapping, map the user to the “Citrix Monitoring” database, and tick the role “db_datareader”.
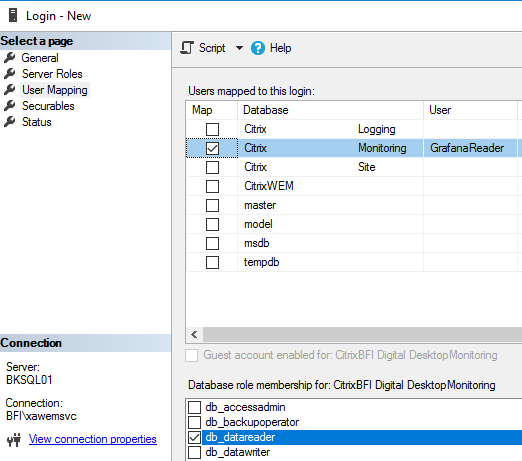
Validate the user creation, and this should be all you need to do on the MSSQL side.
2) Download and install Grafana
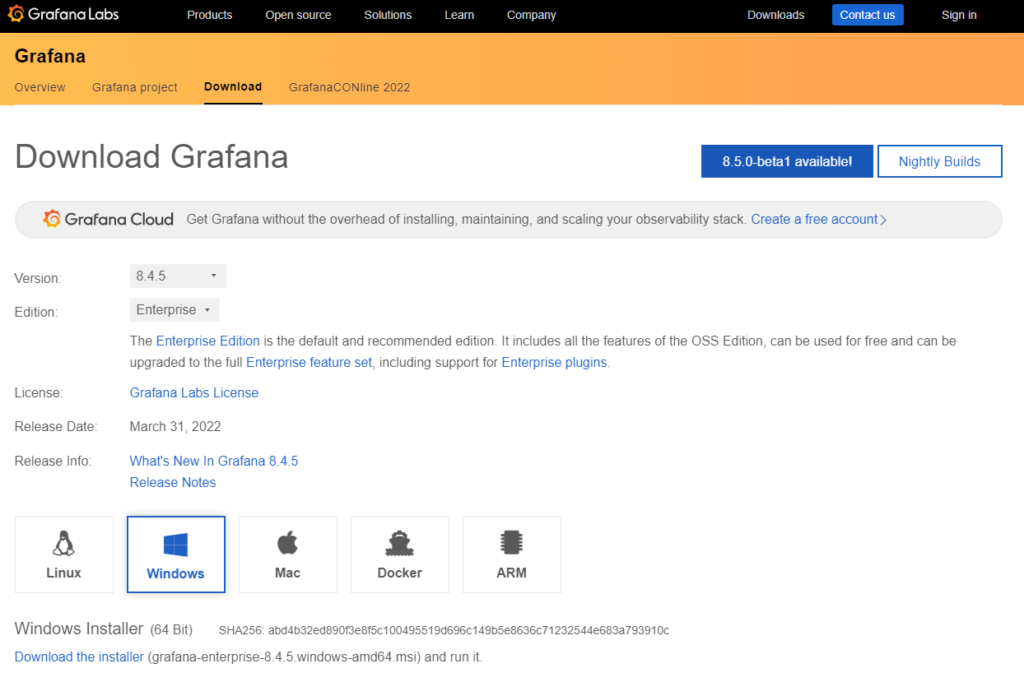
Go to https://grafana.com/grafana/download and download the latest Grafana version for your operating system.
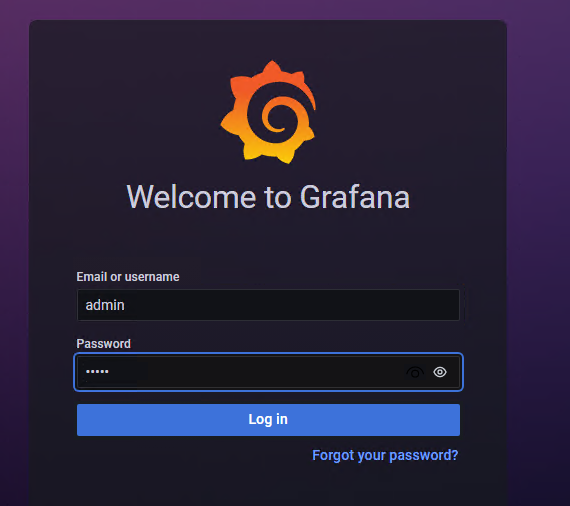
Grafana will listen on port 3000 by default, default username/password is admin/admin, and you will then be asked to change the default admin password. Very straight forward and classic procedure.
Next step is to configure the DB source.
3) Configure the DB Source (MSSQL) in Grafana
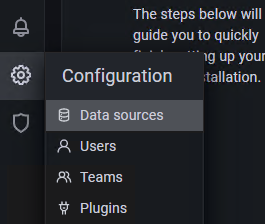
From the left menu, open the configuration menu, and go to Data Sources
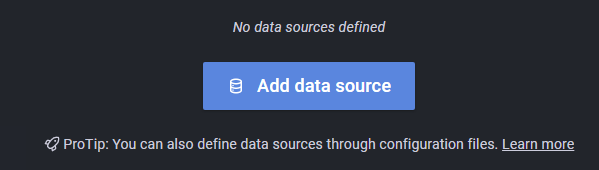
Click on “Add Data Source”
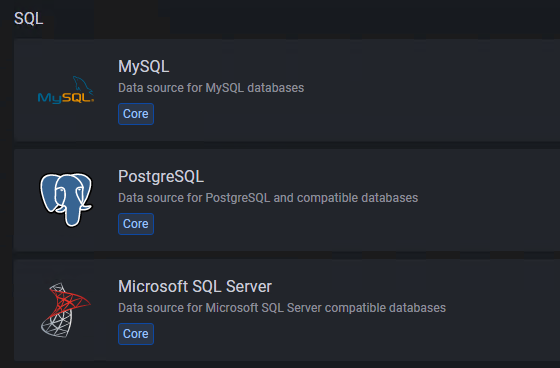
Under “SQL”, choose “Microsoft SQL Server”
Give your connection a Name (for example Citrix Monitoring DB), type in your host address (MSSQL server, using FQDN), the Citrix Monitoring database name, authentication is set to SQL Server Authentication (change this if you are using Active Directory), and the read-only username we have created before.
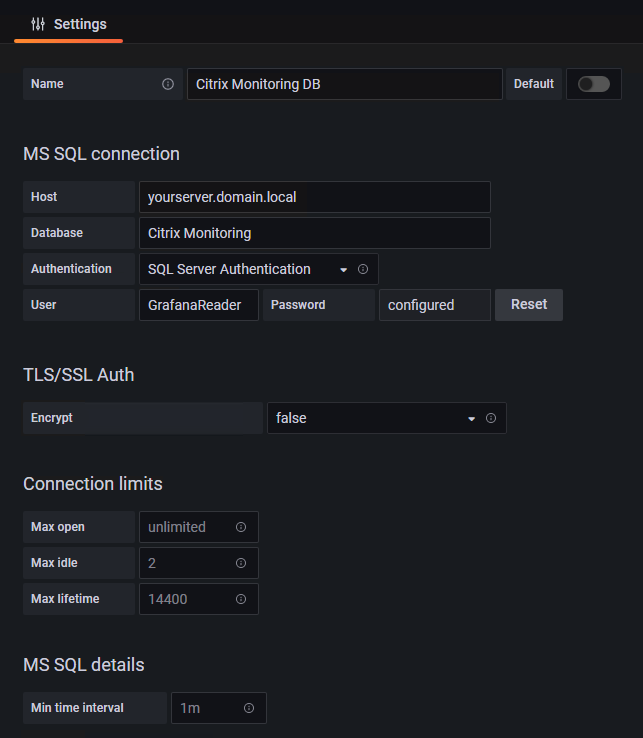
Click “Save and Test” at the bottom, and the test must be successful, otherwise you will need to review your host configuration, database and username above.

Now it is time to create some latency dashboards!
3) Create the user latency dashboard in Grafana
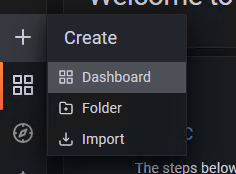
From the left menu, open the “+” menu and select “Dashboard”
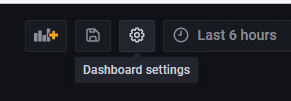
The first thing you want to do now is to name your dashboard and save it. Click on the small gear wheel in the top right corner to access the Dashboard Settings.
Name your dashboard, in this example it will be “Citrix users ICA latency”, then go back and save it using the small floppy disk icon. The next thing is to add a panel for our first user latency view. Click on the small bars with a “+” icon from the top right corner again to add a new panel on your dashboard.
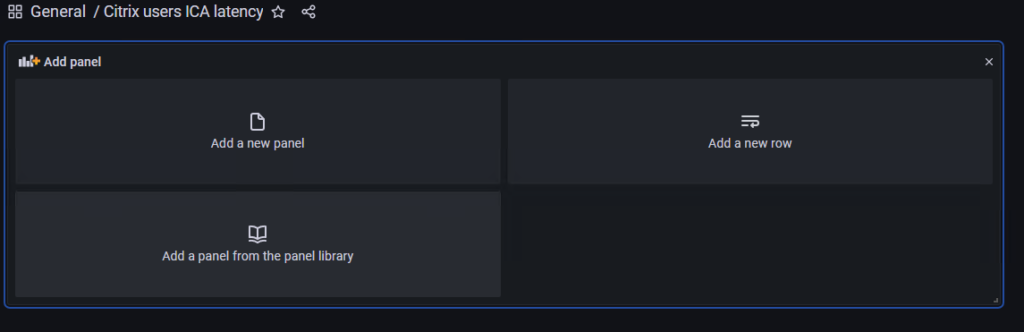
Click on “Add a new panel”. You will be taken directly to the “Edit Panel” view, and there is a default data source set as “Grafana”. This can be quite confusing at first. The next thing we need to do is change the data source to “Citrix Monitoring DB” (or the name you have used in the data source creation above).

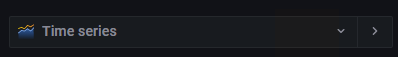
Also make sure that your current panel is defined as a “Time series” on the right:
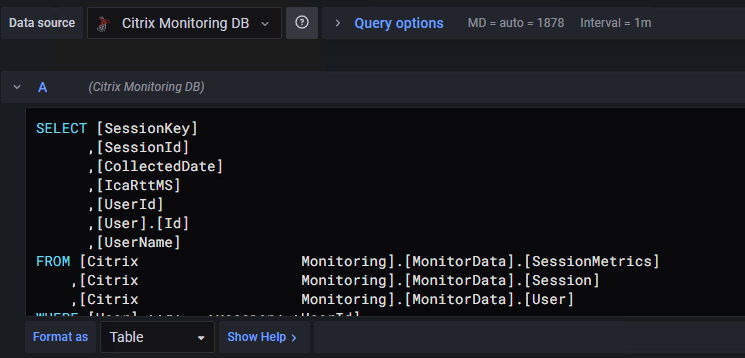
And after this, we need to inject our SQL query to fetch the latency data for a specific user.
Below is the query I am using, probably not the best in the world as I am not a SQL dev-admin. The query will be selecting different type of information, the session key, session ID, date, IcaRttMs (so the RTT latency), the user ID (I need it in two format from two different tables), and the username from the session metrics, session and user tables. The subsequent “Where” operation is here to join and match all the information, and remove null values and anything beyon 900ms to avoid aberrances like “5790” milliseconds, which will break all average calculations.
Replace the “username_samaccountname” value with the user you want to monitor:
|
1 2 3 4 5 6 7 8 9 10 11 12 13 14 15 |
SELECT [SessionKey] ,[SessionId] ,[CollectedDate] ,[IcaRttMS] ,[UserId] ,[User].[Id] ,[UserName] FROM [Citrix Monitoring].[MonitorData].[SessionMetrics] ,[Citrix Monitoring].[MonitorData].[Session] ,[Citrix Monitoring].[MonitorData].[User] WHERE [User].[Id] = [Session].[UserId] AND [Session].[SessionKey] = [SessionMetrics].[SessionId] AND [User].[UserName] = 'username_samaccountname' AND [SessionMetrics].[IcaRttMS] > 0 AND [SessionMetrics].[IcaRttMS] < 900 |
Inject the code just below the Data source, and at the bottom switch the “Format as” Table.
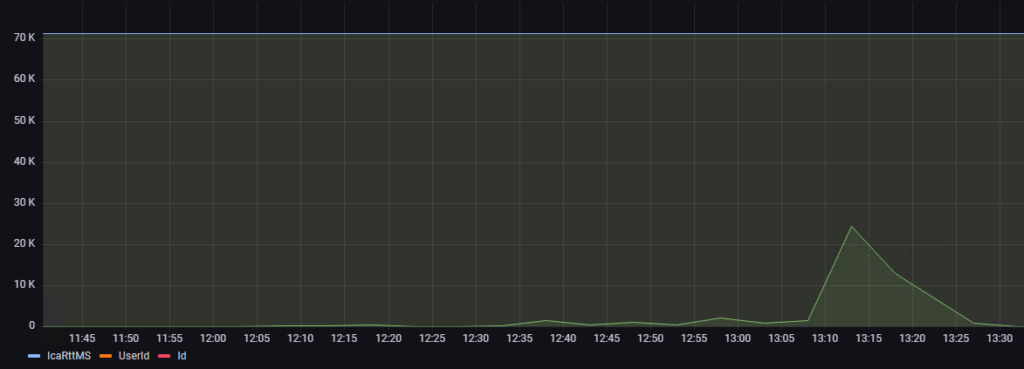
Now you should get a view, but not yet very satisfactory, as the scale is wrong and including some unwanted info like the IDs.
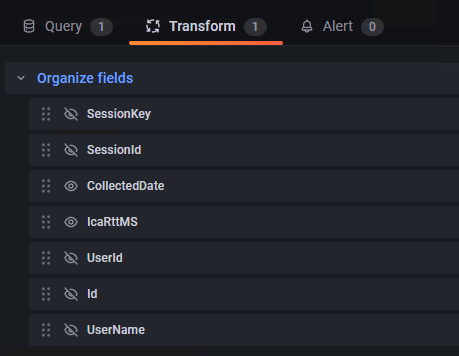
To hide the unwanted values, go to the “Transform” tab, and open the “Organize fields” option. You can then hide all values except “IcaRttMS” and “CollectedDate”. This is all you need to build a Time Series.
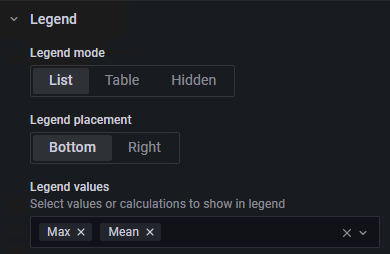
Now in the Time Series options on the right, you can add Legend Values – “Max” and “Mean”.
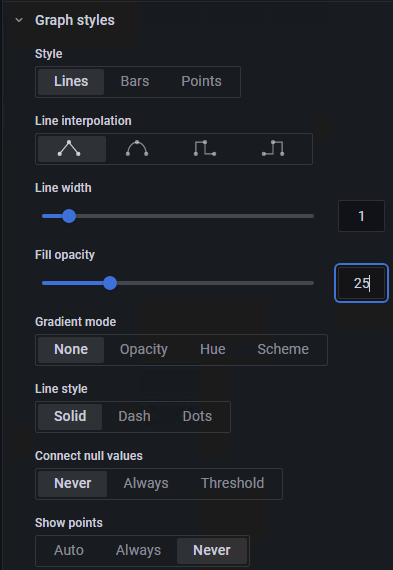
In Graph Style you can add some Fill opacity and in Show Point select Never.
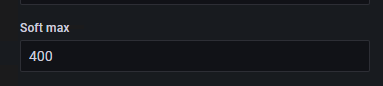
In the Axis options, set a soft max of 400.
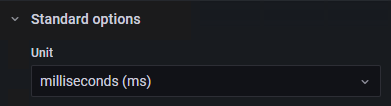
Set the Units as Milliseconds (ms).
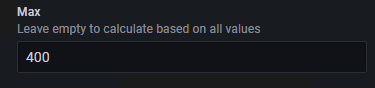
Set”Max” to 400
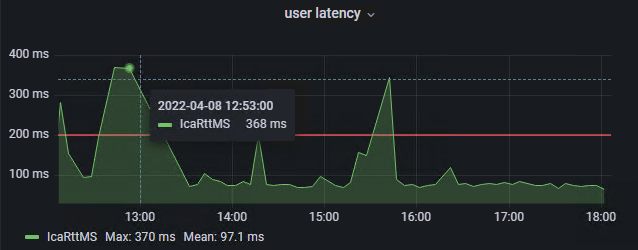
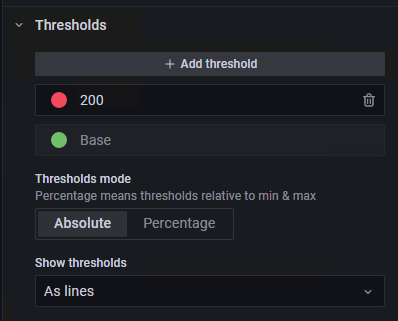
And finally add a Threshold line at 200 ms. Anything above that is considered as a non-acceptable user experience.
So now we get something that look a bit better:
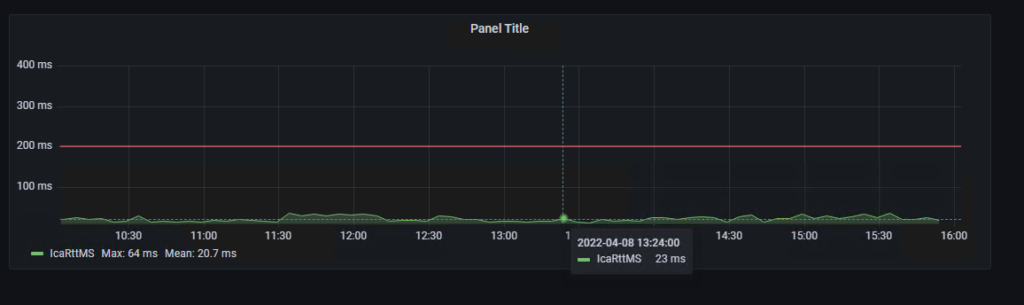
Save it by clicking on the “Apply” button in the top right corner. Now you have your first user latency panel in your ICA round-trip-time latency Grafana dashboard!
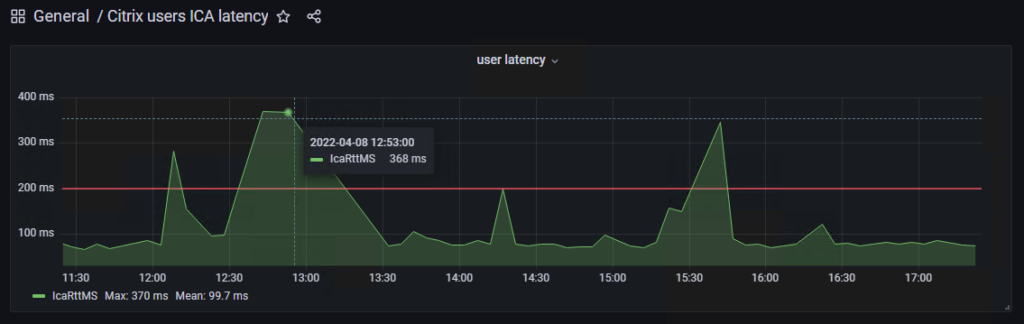
You can rename the panel, duplicate it and change the query, for example if you want to change the username and add multiple users latency on the dashboard.
This will conclude this basic introduction to Grafana dashboard for the ICA user RTT latency in Citrix.