Olivier Marchetta

Dec 192022
 

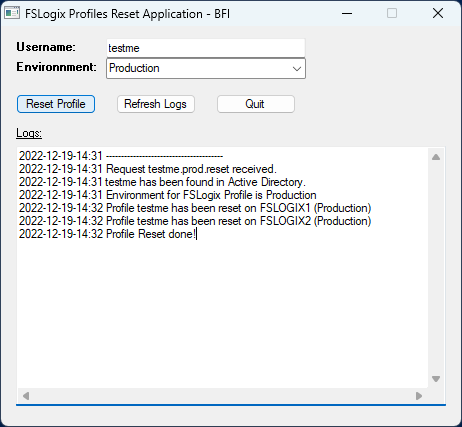
I have developped a small app to replace the “Reset Profile” button in Director, that Service Desk agents love so much, to work with FSLogix.

The application is a client/server model so the application doesn’t require admin rights to work. With ACLs on the executable only Service Desk and Admins can run it. The application can be published in the Start Menu for easy access.

The application will do the following:

  • Check periodically if a reset request has been logged by a service desk agent
  • Check if the user exists in Active Directory
  • Check if the environment is Production or Test
  • Check if the profile is locked
  • Reset (rename) the profile in each location (SMB shares)

The service desk agent type in the username (sam account name), click on “Reset Profile” and then click on “Refresh Logs” to see the result of the action. If the username doesn’t exist in AD, or if the profile is locked, this will appear in the application interface.

The application works with a frontend VB script compiled with AutoIT, and a PowerShell script running on a management server with a service account with rights to rename folders in the SMB shares. The app has been designed to work with Cloud Cache and multiple file shares.

The frontend application send a text file containing the username information to a share on the management server. The PowerShell script will check for request files in the local share, process the request, and delete the request file.

The VB script in AutoIT is the following:

And the PowerShell script running on the management server:

Just compile the first script, that’s your app.
Run the PowerShell on the management server.
Create a local share on the Management server in:

I run the compiled app from:

And the logs are read from:

Update the server names to match your environment. Enjoy!

Aug 242022
 

This article will not be purely Citrix related, but I really wanted to share this. I have been tasked over the years to decommission old Active Directory controllers, here and there, and if the de-promotion is usually fairly easy, and other roles migration like DHCP are also pretty much straight forward, the DNS role can be a little bit more tricky. It requires some monitoring, and the ability to generate reports for the different teams, to ask them to remove the manual DNS configuration pointing to the old AD server, which can be print servers, servers, phones, fixed workstations, kiosk machines etc.

The Tools

To generate a fancy and easy to read report with comprehensive information about who/what is still querying the DNS server, different open source tools will be used:

1. Wireshark

No need to present Wireshark. This is probably the most known packet capture tool out there. And this the one we will be using for capturing the DNS traffic. Download the package from Wireshark · Download.
Installation screen captures:

2. Nmap

Nmap is also famously known as the open source port scanner tool. This tool will be used to get information from the machines captured by Wireshark. Nmap can discover the hostname, operating systme, etc. Download the package from Download the Free Nmap Security Scanner for Linux/Mac/Windows. Note that you do not need to download and install the “npcap” library, as it is already installed by Wireshark.

3. Python

Python will be used for converting the results into Excel pivot tables. Download the package from Download Python | Python.org.

4. Nmap XML to CSV python script

Finally, an useful and well conceived script that will transform the Nmap scan result into an Excel file using pivot tables, making a clear report of who/what is still using DNS. Download the script at GitHub – NetsecExplained/Nmap-XML-to-CSV: Converts Nmap XML output to csv file, and other useful functions.

Note: Find the installation screen captures for the different tools at the end of this article.

Capture the DNS traffic (clients source IP)

Wireshark has a built-in DNS filter, making the capture a very simple and easy task. Obviously, Wireshark must be run on the DNS server itself (do I need to mention it?).
Just start Wireshark as Admin, select the active network interface (or the one used by the DNS server) and enter the following filter:

ip.dst == <your-dns-server-listening-ip> and dns

Now Wireshark is only capturing DNS traffic (in the column “Protocol”). Note that the capture, at this stage, is using the server memory (RAM). Let the capture run for an hour or two, or even for half a day, depending on your memory (RAM) availability.

Stop the capture and then save it to CSV. Go to File > Export Packet Dissections > As CSV… .

Open the CSV file in Excel and as we only need the clients source IP, delete all columns except “SOURCE“. In Excel, go to the “Data” tab and click on “Remove duplicates”.

Now we should have a single occurrence of the clients source IP addresses. Copy the list back to the server, in a text file. The text file will be saved at this location:

C:\Users\Admin\Documents\wireshark.capture.txt

Scan and ID the clients with Nmap (and view with ZenMap)

Now that we have a list of source IPs sending DNS queries to our DNS server, we will scan the list using Nmap to identify the targets. The process will be using a reverse DNS resolution and port scan to identify the hostname and operating system.

The first step is to use Nmap from the command line. Using an elevated CMD terminal (run as Admin), with the following command:

nmap -T4 -A -v -R –dns-servers 179.94.78.999 -iL “C:\Users\Admin\Documents\wireshark.capture.txt” -oX “C:\Users\Adin\Documents\nmap-output.xml”

Command line arguments explained:
– T4: Timing template, from 0 to 4. 4 is “aggressive”. Nmap could be flagged as hostile by some systems, so you may need to lower this down. Scanning will then take more time.
– A: Detect the operating system.
– v: Verbose mode.
– R: Using reverse DNS resolution, to find the hostname. You need a reverse DNS lookup zone.
– –dns-servers: Specify a DNS server with the domain zone as primary zone (with reverse lookup).
– iL: Path to the text file containing the list of IP addresses captured with WireShark.
– oX: The output file path, in XML format.

Nmap will process the IP addresses and this can take a while.

When completed, you should now get an XML file in your Documents folder. It is now possible to open the Nmap – ZenMap GUI tool to check the scan result.

Go to Scan > Open Scan. Open the XML output file. Now you should get a visual view of the hosts behind the source IPs scanned by Wireshark, with the hostname and operating system (visible with a logo):

There is now enough information to identify the targets. Unfortunately, ZenMap cannot export the view to an Excel format. Which is often what we need to share the information. But a Python script is here to help us.

Export the view to Excel (Pivot Tables) with Python

Nmap – ZenMap cannot export the host scan to an Excel format, but with the “Nmap – xml2csv” python script available on GitHub, this is now possible with just a command line. Install Python on the server and downoad the script (links provided above). Then open a CMD and run:

python xml2csv.py -f “C:\Users\Admin\Documents\nmap-output.xml” -csv “C:\Users\Admin\Documents\scanreport.csv”

And this is what you should get for confirmation from the script:

Great. Now it’s time to copy the CSV file on the local desktop and to fire up Excel.
In Excel you should see the columns :

Go to “Insert” – “Pivot Table”:

For the data input, select the first sheet with the columns and select the top columns.
For the destination just select “New Worksheet”.

Now you can select how to arrange your new pivot table view.
Note that the order of selection is determinant. I like to select, in this order:
OS – Host – IP.

And this is the view presenting the hosts by OS, hostname, and IP:

Now it is easy to locate and update the servers manually pointing to the old DNS server that we are decommissioning. A lot better than just a raw list of IPs!

Installation screen captures

Wireshark installation screen captures:

Nmap installation screen captures:

Python 3 installation screen captures:

Jul 072022
 

When a UPM to FSLogix profile big-bang migration ends up in a total train wreck.

Storyline: I have used a migration script, modified from the David Ott script, which you can find on this website, and it works very well. But the script will not detect damaged or bad UPM profiles, and that’s when the project can go wrong. It is like watching a rocket launch, so far so good, 75 users ok, 150 users ok, 300 users ok, monitors are all ok, green lights, 400 users… And suddenly all the Citrix Desktop servers begin to freeze and no one can work. All dashboards blinking in red. So what happened? Let’s investigate the crash site and see what led the rocket to bend and explode in mid-air….

Once upon a time…

First, the migration takes place on Windows Server 2016 with FSLogix 2201 (not HF1) and Cloud Cache. This operating system has a very weak Start Menu, using a deprecated technology to manage the shortcuts and the “tiles”. It use a database, and always was before this deployment a source of numerous issues. The Start Menu would freeze or not refresh the icons at logon. With UPM, Citrix has deployed several fixes for this, to use in combination with different registry keys like the “ImmersiveShell\StateStore” “Reset Cache” key, or clean the UFH/SHC key (also a deprecated feature! But still impacting Windows 2016). If I remember well Citrix fixed the issue once for all with the 7.15 CU3 release, but would only work with a clean install, using a VDA clean-up tool, and a proper re-install of the VDA. But it seems that in our user base, many profiles were still “broken” and had a broken start menu…. Something that FSlogix was not aware of?

Pre-Migration test and early adopters… all is fine!

So we migrated 75 users initially, using the migration script, from UPM to FSLogix. We experienced a couple of black screens, but first it was mainly due to the infrastructure – using a very slow file server hosting many other roles and sometimes due to the Start Menu cache or the UFH/SHC key that would need a good clean-up. And we tested FSLogix inside out, thoroughly, for a full five months. We migrated the profiles to brand new file servers, dedicated, with enough resources, and using a large 8 TB disk formatted in ReFS. The logs showed that, in terms of infrastructure, the disks would be access and mapped in less than 100ms before the shell would kick in. Logon were super-fast. No reliability issues. Everyone was confident, this migration will be a success, we kept the champagne in the freezer, it was already a done deal and just waited for the celebration day…..

Houston, we have a problem…

Before the big bang, I migrated another 25 users for 3 to 4 days, and we didn’t notice anything except one, a single one, server freeze. This is not uncommon, and in the morning checks the service desk and Ops team would just investigate the issue quickly, RDP to the server, if frozen or slow, put it in maintenance mode, restart it and if it is solved, then the ticket is closed and sent to the archives. I have been made aware of this freeze, but the issue was not reported as critical yet, so I didn’t investigate it myself. We had 49 other active servers without any issues on 100 FSLogix profiles and 400 UPM profiles. So I began the big-bang migration.

The rate was done at 50 users per night, and we would monitor the logons in the morning and throughout the day. We quickly raised the FSLogix users from jsut 100 to 300. So far no issues. But when we reached 350 users, the service desk started to report black screens and slow logons. I quickly pushed the Start Menu reset cache reg keys, as I know this could fix the problem, and migrated another 50 users that same day to reach 400 FSlogix users.

That’s when hell broke loose, and all started to flinch. The next day, the service desk reported that a group of users, around 10, would have black screens at logon, but many more would report a frozen server.

There was a bit of a reaction time here from me, still very focused on finishing the migration. The target is 600 profiles. I would just ask the SD/Ops to put the servers in maintenance mode, and add them to the restart queue for the night, while I was adding more users to the migration – big mistake.

The day after we had no options but to realise that 7-8 servers would randomly freeze in the morning, with black screens for over 100 users. That’s when I moved my focus to the issue.

Looking into the FSLogix log files first, to see nothing but no errors and a fast disk access an mapping, stlil under 100ms, before the shell would kick in. Citrix Director would report the logon time as 30 seconds, when the users would have a black screen for 10 minutes or more!

At this stage I didn’t know if it was the server that could not cope with the load of FSLogix profiles over UPM profiles, or of it was a user issue. My second mistake was to make a too fast conclusion that it was the server itself and not the profiles causing the issue. Reviewing KBs and other community posts, I realise that maybe FSLogix verson 2201 without the HotFix1 was the problem. Maybe the AppReadiness service was the issue even If I knew that it never caused any issues before, but now maybe under the load of so many profiles on the server? Another thing is that we knew that the black screens would last longer than 5 minutes, so I was quite sure that the AppReadiness service was not the cause of the black screen, but I would nevertheless do something about it too.

So I opened the Gold Image, and made a couple of integrity check, upgraded FSLogix to 2201 HF1, added some Windows Updates, reviewed the Start Menu policies and clean-up scripts (removing them), changed the AppReadiness service startup to automatic (as we have plenty of memory, I do not care about it staying up all day). And published the image to some servers…. without any improvement.

This mistake made me lose a crucial time, I didn’t drill down right on the issue so the users started to complain about the project, and the SD team joined them, the management would now ask to take the project to a halt and even reverse some profiles back to UPM. I had to intervene and ask everyone to keep their blood cold, and provide more inputs so we have a better chance to at least mitigate the issue.

Looking in details to the servers logs, Applications logs, I finally found the cause. A TileDataLayer DB file, in the user AppData Local folder, would be locked or corrupt and this would cause the Start Menu on the server to crash when trying to open the file in loop, impacting everyone else on the server (Start Menu would fail for all users on that server), and would expand the issue to the taskbar after a while, and then block all applications UI, eventually…

I was able to isolate one user, log him/her off, and ask the user to login again. I could then see that the issue would happen instantly for the same user when the shell would be started. And freezing the entire server. I then locked the account to open the FSLogix container on the fileserver, navigate to the folder and delete all the DB files inside the profile disk.

After this, the user would not experience the issue at logon. Using a quick and dirty PowerShell script, I was able to scan all Application logs on each server and locate the issue. Giving me a sort of dashboard nearly in real time to see who would login with a bad profile and impact a server.

I could then locate the user and try to mitigate the issue. But the damage is already done, so the best option is to let the day end, with a couple of very slow, near-dead servers, but make a list of the bad profiles and fix them at night…..

Conclusion

What could have prevented the disaster? On such limited resources as me being the sole consultant doing the migration, with a limited service desk resource, I must have used a double safety net and not attempt such a fast paced migration. The long testing phase with only 75 users, followed by a very fast paced migration of 50 users per day to reach a large target of 600 users is I think the issue here. It was too slow at the beginning, and too fast at the end. A recipe for a crash to happen at the next turn.

I didn’t take the steps back to look art the big picture on the project timeline and failed to use measures of safety. In the end, even if 40 out of 50 servers are still working everyday without being impacted, the project is still considered as a massive failure. The user experience was degraded, substantially, and the negative atmosphere has spread on the user’s IT slack channel, and on the Service Desk team, to finally spread the panic to all IT staff. Technical actions were taken with a short lag and delay, errors were made, followed by better focused actions, but that was too late to contain the bad image and bad user experience for this technology. And it is now just water under the bridge to have the users returning to peace. Lesson learned?

Apr 272022
 

In my current project work, I have been tasked to configure our VDAs (Windows Server 2016) to claim all memory in VMware, and disable all dynamic memory mechanism on the ESXi 6.7 hosts with 512 GB of memory each. I’m sharing my notes in this blog post for future reference.

The memory sizing in VMware include the hypervisor system memory, guest memory, memory overhead and reserved memory for test machines and gold images.

System Memory (VMware host):

ESXi 6.7 requires a minimum of 4 GB of physical RAM. (ESXi Hardware Requirements (vmware.com)).

Reserved Memory for Test Machines and Gold Images

In the project environment, there is a total of 4 Test virtual machines and 2 Gold Images virtual machines on each site.

Each test virtual machine has a memory set to 30 GB.
For the Gold Images, there is a total of 2 virtual machines using 15 GB of memory each.

With 5 ESXi hosts on each site, the reserved memory on each host will be equal to 32 GB, so at least 1 test machine can be booted on each host or 2 Gold Images on a single host.

Memory overhead

Overhead memory includes space reserved for the virtual machine frame buffer and various virtualization data structures, such as shadow page tables. Overhead memory depends on the number of virtual CPUs and the configured memory for the guest operating system. This is because each core will address its own memory range.

VMware provides a table sample for memory overhead:

To expand the memory overhead usage, we will use the 8 VCPUs model. The target is 90 GB of RAM per VM. According to this model, 90 GB of RAM equals to 720 MB of Memory overhead.  1.5 GB will be used for safety.

Memory Sizing Formula

The formula, including all the elements above, on a 90 GB per VM target, 5 VMs per host, 512 GB of RAM on each host, is as follow:

(Total Host Memory – System Memory – (((Guest Memory + Overhead)* 5) + Reserved Memory)

(512 – 4 – (((90 + 1.5) * 5) + 32) = 18.5 (free memory left)

This would leave 18.5 GB of Memory as spare memory on each host, or a 96% memory reclamation.

Memory Reservation

Memory over-commitment will allow the virtual machines to start on a physical host even when exceeding the available physical memory. When this happen, virtual memory swap and compression will be triggered for sharing the available physical memory. This will impact performances and should not be allowed in the Citrix environment.

Each VDA virtual machine in VMWare should be configured with “Reserve All Guest Memory (All Locked)” under the memory options.

Memory compression cache

In case of a memory over-commitment, the memory page file to be swapped out will be compressed beforehand to accelerate this operation when it occurs. If memory requests comes in to access a compressed page, the page is decompressed and pushed back to the guest memory. The page is then removed from the compression cache.

In a Citrix VDA configuration with full memory reservation for each guest, the memory compression cache operation is not needed.

To disable the compression, on each host, in Advanced System Settings, set:
Mem.MemZipEnable = 0.

Large Memory Page Size

Windows Server allows software to use 4KB, 2MB and 1GB pages. We refer to 4KB pages as small pages while 2MB and 1GB pages are referred to as large pages. Large pages relieve translation lookaside buffer (TLB) pressure for virtualized memory, which results in improved workload performance.

While the biggest performance impact is achieved if large pages are used by the guest and the hypervisor, in most cases a performance impact can be observed even if large pages are used only at the hypervisor level.

To enable large pages in VMware, on each ESXi host, in Advanced System Settings, set:
Mem.AllocGuestLargePage = 1.

Backing Guest vRAM with 1GB Pages

ESXi 6.7 provides a limited support for backing guest vRAM with 1GB pages, referred as Huge Page Files in the VMware documentation. Same as for Large Memory Page Sizes, this will allow to reduce the pressure on the TLB mechanism and improve performance.

A VM with 1GB pages enabled must have full memory reservation. Otherwise, the VM will not be able to power on. All of the vRAM for VMs with 1GB pages enabled is pre-allocated on power-on.

In order to use 1GB pages for backing guest memory you must apply the option at the VM level: sched.mem.lpage.enable1GPage = “TRUE”.

Ballooning

The ballooning driver included with the VMware Tools will trigger memory pages swap to disk at the OS level when the target memory is reached. This feature is not needed with full memory commitment and the driver will be turned off.

Add the following parameter at the virtual machine level (VM Options):
sched.mem.maxmemctl = 0.

Transparent Page Sharing

This feature is the equivalent of memory deduplication. The memory pages will be scanned regularly to be de-duplicated amongst the guest on a given host. Page scanning in a hardware assisted memory virtualization can have a limited performance cost, but in a setup for Citrix with full memory allocation this feature can be intentionally be turned off.

In the guest advanced options, enter the following option:
sched.mem.pshare.enable = FALSE

On the host, to disable TPS, and avoid CPU cycles to be used for this purpose,
change the value at the host level:
Mem.ShareScanGHz = 0.

Configuration Summary

Virtual MachineESXi Host
sched.mem.lpage.enable1GPage = TRUEMem.ShareScanGHz = 0
sched.mem.maxmemctl = 0Mem.AllocGuestLargePage = 1
sched.mem.pshare.enable = FALSEMem.MemZipEnable = 0
Memory = 90 GB. Allocate all memory (locked) 

Memory Utilization alerts

When reclaiming all memory, alerts with 100% “Memory Active” can show up, and depending on the ESXi version, this is by design but is still an issue for Virtual Machines in the specified configuration.

 ESXi’s active memory metric, despite being called “Memory Utilization” or “Memory Usage” in different parts of the UI, is in no way related to the in-guest memory metrics. It doesn’t show how much guest OS memory is available nor how much guest memory is in an “active” working set or “resident”. It is only used for making memory reclamation decisions in addition to other resource controls like shares, limits and reservation

“Memory Active” is a heuristic utilizing a weighted moving average based on reads and writes to a small, moving subset of pages of the Virtual Machine’s memory. The sampling of this subset of 100 random pages over one minute also incurs a minimal overhead and pre-allocating memory is designed to remove most possibilities of jitter. The Virtual Machine configurations mentioned in the Symptoms section force a full memory reservation and are not subjected to reclamation techniques, hence memory sampling is disabled and active memory will default to a display value of 100%.

Resolution:

This is a display artefact only and has no negative performance impact on the virtual machine or the host it is running on. To limit false positives, the memory activity for VMs with pre-allocated memory has been reduced to 75% in ESXi 7.0 U2.

 Workaround:

Disable the Virtual machine memory usage alarm to avoid false positives at the vCenter level.

The following rules will be disabled at the vCenter level (impacts all clusters):
– VKernel VM Memory Utilization
– VKernel Host Memory Utilization
– Host memory usage
– Virtual machine memory usage

The rules will be re-added for each cluster that are not for VDAs.

VM/Host Rules

The new memory configuration for the VDA creates a de facto “static assignment” of VMs to Host in the Citrix VDA cluster. Virtual machines are now “too big to be moved”, and vMotion will not be possible.

VM/Host rules have been created at each cluster level. Virtual machines will not be allowed to start on a host not matching the VM to Host assignment rule.

WEM Memory Optimization

WEM Memory Management / Optimization was enabled in the BFI Citrix environment, when the Appstore servers were limited to 32 GB each. WEM was periodically reclaiming the committed memory of idle processes. This technique would increase the load on the storage, by flushing paged memory in RAM but idle to the page file. With the new memory setting, the optimization is turned off in all environments.

Windows Server page file size

The page file size on the VDA servers (Windows Server 2016), will be changed to a fixed 16 GB file on the system drive (C drive). This is to support the large memory size and committed memory.

In the Tasks Manager, Performances, under the memory tab the total committed memory is now equal to 90 GB (Memory) + 16 GB (Page File):

The setting is defined at the Gold Image level.

Clear Page File at Shutdown

The “Shutdown: Clear virtual memory page file” setting was enabled in the Environmental group policy.

This option is a security setting but with Citrix MCS the page file is not kept and erased at shutdown and restart. Due to the new page file size, and to eliminate potential slow down or restart failures for the week-end and scripted restarts, this option has been disabled.

Apr 082022
 

Citrix doesn’t provide, out of the box, even with Director, an in-depth latency visualisation for a specific user, or even a group of users. But this is achievable, and in a pretty nice way, using Grafana and the native SQL connector, pointing to the Citrix Monitoring DB.

This tutorial will give you the step by step process to add a user latency monitoring (ICA RTT) in Grafana, for free:

1) Configure a GrafanaReader DB account

It all start by configuring a READ ONLY user account in MSSQL. Read only is mandatory and very important. Oh, I can read your mind right now… do I hear a “yeah.. I don’t need that, I can do it with my admin account, I’m invincible (or super lazy)”? Well, if you do not intend to create a dedicated READ ONLY account, then please leave this tutorial immediately – no jokes! Now that this point has been made crystal clear, let’s proceed.

I prefer to use a local SQL account for Grafana. But depending on the security policies in place in your organisation, you might prefer using an AD account.

Load up SSMS (SQL Server Management Studio) and login with admin rights to the MSSQL server hosting your Citrix databases (including the Monitoring DB). Under Security / Logins, Create a New Login.

In my case, I create a native SQL account “GrafanaReader” and disable password change (Enforce password policy). Again, you might want to make it more secure, use an AD account, or enforce a password policy.

Server Role: leave it as “public” only. This is just a reader account.

Now the essential part, in User Mapping, map the user to the “Citrix Monitoring” database, and tick the role “db_datareader”.

Validate the user creation, and this should be all you need to do on the MSSQL side.

2) Download and install Grafana

Go to https://grafana.com/grafana/download and download the latest Grafana version for your operating system.

Grafana will listen on port 3000 by default, default username/password is admin/admin, and you will then be asked to change the default admin password. Very straight forward and classic procedure.

Next step is to configure the DB source.

3) Configure the DB Source (MSSQL) in Grafana

From the left menu, open the configuration menu, and go to Data Sources

Click on “Add Data Source”

Under “SQL”, choose “Microsoft SQL Server”

Give your connection a Name (for example Citrix Monitoring DB), type in your host address (MSSQL server, using FQDN), the Citrix Monitoring database name, authentication is set to SQL Server Authentication (change this if you are using Active Directory), and the read-only username we have created before.

Click “Save and Test” at the bottom, and the test must be successful, otherwise you will need to review your host configuration, database and username above.

Now it is time to create some latency dashboards!

3) Create the user latency dashboard in Grafana

From the left menu, open the “+” menu and select “Dashboard”

The first thing you want to do now is to name your dashboard and save it. Click on the small gear wheel in the top right corner to access the Dashboard Settings.

Name your dashboard, in this example it will be “Citrix users ICA latency”, then go back and save it using the small floppy disk icon. The next thing is to add a panel for our first user latency view. Click on the small bars with a “+” icon from the top right corner again to add a new panel on your dashboard.

Click on “Add a new panel”. You will be taken directly to the “Edit Panel” view, and there is a default data source set as “Grafana”. This can be quite confusing at first. The next thing we need to do is change the data source to “Citrix Monitoring DB” (or the name you have used in the data source creation above).

Also make sure that your current panel is defined as a “Time series” on the right:

And after this, we need to inject our SQL query to fetch the latency data for a specific user.
Below is the query I am using, probably not the best in the world as I am not a SQL dev-admin. The query will be selecting different type of information, the session key, session ID, date, IcaRttMs (so the RTT latency), the user ID (I need it in two format from two different tables), and the username from the session metrics, session and user tables. The subsequent “Where” operation is here to join and match all the information, and remove null values and anything beyon 900ms to avoid aberrances like “5790” milliseconds, which will break all average calculations.
Replace the “username_samaccountname” value with the user you want to monitor:

Inject the code just below the Data source, and at the bottom switch the “Format as” Table.

Now you should get a view, but not yet very satisfactory, as the scale is wrong and including some unwanted info like the IDs.

To hide the unwanted values, go to the “Transform” tab, and open the “Organize fields” option. You can then hide all values except “IcaRttMS” and “CollectedDate”. This is all you need to build a Time Series.

Now in the Time Series options on the right, you can add Legend Values – “Max” and “Mean”.

In Graph Style you can add some Fill opacity and in Show Point select Never.

In the Axis options, set a soft max of 400.

Set the Units as Milliseconds (ms).

Set”Max” to 400

And finally add a Threshold line at 200 ms. Anything above that is considered as a non-acceptable user experience.

So now we get something that look a bit better:

Save it by clicking on the “Apply” button in the top right corner. Now you have your first user latency panel in your ICA round-trip-time latency Grafana dashboard!

You can rename the panel, duplicate it and change the query, for example if you want to change the username and add multiple users latency on the dashboard.

This will conclude this basic introduction to Grafana dashboard for the ICA user RTT latency in Citrix.

Mar 192022
 

Find the notes from the latest Citrix Tech Talks:

Under the hood of Citrix Cloud

Replay Link

Citrix Cloud: new consoles and plans to bring them to on-prem
WEM: optimizations development still in progress
Session Recording: new agent for compliance recording and troubleshooting, available in the ISO.
App Layering: with new UI experience, release of 2112 version of App Layering, better performances, optimized workflows/ App Layering as a service is in development and will be integrated in Citrix Cloud in a near future, probably with different services as standalone, not all in one block.
Image Portability Service: Disk image conversion, (MCS/PVS conversion, on-prem or in the cloud, good case for DR), Azure and Google Cloud supported, AWS in the future, and more on-prem hypervisors.
Workspace App: Full workspace experience cross-platform. Authentication improvements. Inactivity Timeout. StoreFront to Workspace migration made easier. Config service in the cloud, help you to configure the endpoint. Autodiscover based on Email ID. Custom portals can now be embedded in Workspace App, to replace the browser. Better support for App Protection in this case and working with custom portals integration. Citrix Files accessibility from Teams, variations between CWA LTSR and CWA CU – recommended to try CU for new features if possible. Each CU is supported for 18 months. Different update channels. New embedded browser inside Workspace App. App Protection on MacOS and Linux.
Performances: Dual monitors and 4K now exponentially used by the end users. Leverage GPU abilities to improve performances on the display protocol. VDA side optimizations, and also client side side optimizations (to cope with how much data is sent). Not just typical Windows workstations. Session screen sharing screen (in Zoom meetings, etc) can impact performance, doubling the bandwidth on the VDA (duplicating the stream), but is somewhat negligible after testing in terms of impact. Encoding and decoding twice, but still has a minimal cost. Trying to find a way to eliminate the double hop scenario. For GPU, Nvidia, AMD, Intel supported (so no change).
Citrix Cloud: service availability, feature name is Service Continuity, guarantee minimum impact on outage (IDP, Azure, Workspace, Citrix Cloud, many components), new architecture design for failures, to apprehend what happens when the Cloud is down. Connection Lease: sync files in the AppData folder, valid for 1 week, then invoke the files if the authentication components are not online (IDP) and even brokering. Introduced in Q2 last year, will be introduced for browsers (requires an extension), supported in native CWA. The idea if to replace the LHC experience when the Access Layer is on-prem. With service continuity, if the VDA are on-prem and the infrastructure layers in the Cloud, if the Cloud is down and not available, users can still login to the VDA. Connection lease is refreshed every time the user connects to Citrix Cloud. Service Continuity companion guide to test every single possible type of outage, simulate outages.

New LTSR-CWA-Teams: Should I stay on 1912? The discussion is driven by the feature sets. Teams optimization requires a CWA upgrade. The Workspace App is the heart of the operation. The CWA has the media engine, connection is made via virtual channels to the VDA, and the VDA opens a web socket connection to the Teams App, then it has an end to end path for Teams to communicate with the media engine on the endpoint. Inside team there is a Citrix API, directly handed over to Microsoft, released transparently. Citrix introduce updates or fixes to the Citrix API for Teams, handed over directly to Microsoft and loaded into Teams transparently without requiring any upgrade. Sometimes an upgrade is needed when there is new features introduced, like multi-windows, and will need an MSI upgrade for Teams. The Citrix API for Teams usually doesn’t require any specific MSI version of Teams, it is downloaded into teams and is the brain of the operation. The Citrix API will connect to the media engine on the endpoint, and the media engine performs the off-load. And that’s on the CWA that new features are introduced (see the timeline above, in the screenshot), like multi-window for multi-monitors to split (detach/decouple) Teams on different monitors. App Sharing will require both VDA and CWA upgrades. Usually an older VDA would work, but exceptionally Multimonitor, App Sharing and MultiWindow requires a VDA upgrade. So staying on 1912 LTSR will not allow to access these features. CVAD 2203 is the recommended version to have all the features. For the CWA, again there is a recommendation made to be on CU for new features. CTX253754 is where you find the most up to date information about Teams integration and issues (Troubleshooting HDX Optimization for Microsoft Teams (citrix.com)).

Mar 182022
 

The global formula to calculate MCS storage capacity planning, according to the Citrix knowledge base (see Machine Creation Services (MCS) Storage Considerations), is the following:

(number of defined storages in selected hosting connection * number of max. expected updates until complete reboot of machine catalogue and 12h wait time * actual image size * number of machine catalogues using this image)  + (number of max. CCU * 15% from image size) + (number of vm´s * 16 MB) (+ for VMware (number of vm´s * VM swap file *2))

This formula has been proven to be quite reliable over the years. It can be ventilated in a table to make it visually easier to understand. Note that the units is in MB, not GB.

We will take an example of a single LUN in the shared storage (the Hosting connection) used for both OS Storage and Temporary storage, with 3 machines catalogues (Test, UAT, Production), and 2 simultaneous disk updates. The target is 30 virtual desktop agents (Multisession hosts, Windows Server) and 300 users. The VMware swap file will be standard size of 512 MB and the identify disk is always 16 MB with MCS:

In this example, for the MCS storage capacity planning, the formula is the following:
(1*2*122880*3) + (300*18432) + (30*16) + (30*512*2) = 6298080 MB.
It is possible to use Google to calculate the formula for you, just to let this good old calculator at rest:


The storage capacity planning on SSD to provision is equal to 6.3 TB.
It is realistic to target an initial provisioning of 6 TB with Thin Provisioning.

Mar 172022
 

Following the “PrintNightmare” security vulnerability for the Windows Print Spooler Service and the subsequent KB applied by Microsoft, (see KB5005010: Restricting installation of new printer drivers after applying the July 6, 2021 updates), and updates released on August 10, 2021 or later have a default of 1 (enabled) for RestrictDriverInstallationToAdministrators.

As a consequence, the users get the following pop-up when trying to connect to their printers on print server: “Do you trust this printer?“.

It is then required to elevate the process to install the printer driver “as Admin” (Install driver), when before, it was possible for the users to install the Point and Print drivers in their user sessions.

Since PrintNightmare it will be now necessary to configure different options to allow the users to map and install their Point and Print printer drivers dynamically in their session.

1) Configure Point and Print Restrictions (GPO)

  1. Open the group policy editor tool and go to Computer Configuration > Administrative Templates > Printers.
  2. Configure the Point and Print Restrictions Group Policy setting as follows:
    • Policy is Enabled
    • Check “User can only point and print to machines in their forest”
    • When installing a driver (…) “Do not show warning or elevation prompt”
    • When updating drivers (…) “Do not show warning or elevation prompt”
Point and Print Restrictions

2) Configure Restrict Drivers Installation (for Printers)

  1. Open the group policy editor tool and go to Computer Configuration > Policies > Windows Settings > Security Settings > Local Policies > Security Options
  2. Edit Devices: Prevent users from installing printer drivers and set it to Disabled.

3) Deploy registry key RestrictDriverInstallationToAdministrators (GPP)

Create a new registry parameter under the GPO section Computer Configuration > Preferences > Windows Settings > Registry.

  • Action: Replace
  • Hive: HKEY_LOCAL_MACHINE
  • Key path: Software\Policies\Microsoft\Windows NT\Printers\PointAndPrint
  • Value name: RestrictDriverInstallationToAdministrators
  • Value type: REG_DWORD
  • Value data: 0
Registry deployed via GPP

Run a “gpupdate” command on the machine as Adminstrator.

The security pop-up / warning and request for elevation for the Point and Print printers driver mapping will not be shown to the users.

Mar 052022
 

Everyone already knows the famous script from David Ott to migrate Windows Profiles (local) to FSLogix profiles containers. With some modifications the script would work well to convert Citrix UPM profiles to FSLogix.

There is already a good article posted on this website for those who want to use the original script from David Ott:
FSLogix Local Profiles Migration Script

The following script is revamped version, working exclusively with Citrix UPM profiles, and is designed to be a out-of-the-box / turnkey solution to migrate Citrix UPM profiles to FSLogix. All you have to do is enter the user(s) SamAccountName in a text file, and run the script!

The script is meant to be run directly on the file server hosting the FSLogix profiles, as it is still using DiskPart to format the disk, so you cannot run it from the network or remotely – you cannot run DiskPart with network paths! Or if you really want to run it from a different server, it is possible, but then you need to add a Robocopy command at the end to push the profile container to your FSLogix network share. The script is designed to make sure that all user permissions are set correctly.

So this is pretty much it.. Enter the user(s) names in a text file named “fslogixusers.txt” (just update the path to the text file in the script) and run the script!

You need to update the following variables to meet your environment setup:

$users: The path to the text file containing the users (SamAccountName)
$FslogixPath: The path to your FSLogix containers folder, where the converted profiles will be stored.
$UpmPath: The path to your Citrix UPM profiles. Can be a network path.
$UpmProfile: This is to adjust your UPM profile directory structure. By default it is set to the username. If you need to change it for example to Domain\Username then change it there (keep $sam for the username).
$FslogixProfile: Same as above, by default only the $sid is used for the FSLogix container folder. But the script will use the structure Username_SID. You can change this in your FSLogix configuration (GPO) or change this variable.
$VhdMountDir: This should not need to be changed. This is where the profile container is “mounted” on the file system for the profile copy.
$vhd: This is the actual profile container name and format. If you want to switch to VHD instead of VHDX, change it there.

Important Note: The script will use the FSLogix tool “Frx.exe” to create the profile disk. The script expect to find the tool in its default location on the server (“C:\Program Files\FSLogix\Apps\Frx.exe”).
You just need to copy the executable file from one of your server on which FSLogix is installed (Citrix VDA).

Pleas leave a comment if anything is missing.

The Script:

Dec 232021
 

Preamble

It’s a day before Christmas. Everything is fine. Or so it seems. But suddenly, no one can access their UPM profile.
A quick look at the UPM profile folder, and the CREATOR OWNER permission has been removed accidentally by someone and propagated to all subfolders. The users have been “locked out” from their own profiles.
P1 has been triggered. It’s time to use one of these “magic” PowerShell script to restore the situation quickly.

The script

Now that you have restored the correct permission on the main UPM profile folder and share, which is:
– CREATOR OWNER | Subfolders and Files only | Full Control
– Domain Users | This Folder | Read only + Create Folders
– Domain Admins | This folder and subfolders | Full Control
– SYSTEM | This folder and subfolders | Full Control
And the owner is set to SYSTEM
It is time to propagate this again to all subfolders (user profiles folder) with the following script:

And this will run for quite a long time, a couple of hours depending on the number of profiles and the storage / file server performance. It is possible to remove the “-wait” option from the Start-Process, but very carefully as this will create thousands, ten of thousands, of icacls threads. I have seen servers dying under the load and crashing into a BSOD without the “-wait” argument.

Finally the result can be checked manually on each profile folder, and see the inheritance in place. Problem solved, Christmas is saved.

Source: Powershell Replace all child object permission entries with inheritable permission entries from this object – IT Droplets